Project Overview
Preparing for Influenza Season
Performed descriptive analysis of historical influenza data to provide recommendations for medical staffing agency planning across the country
Motivation and Objectives
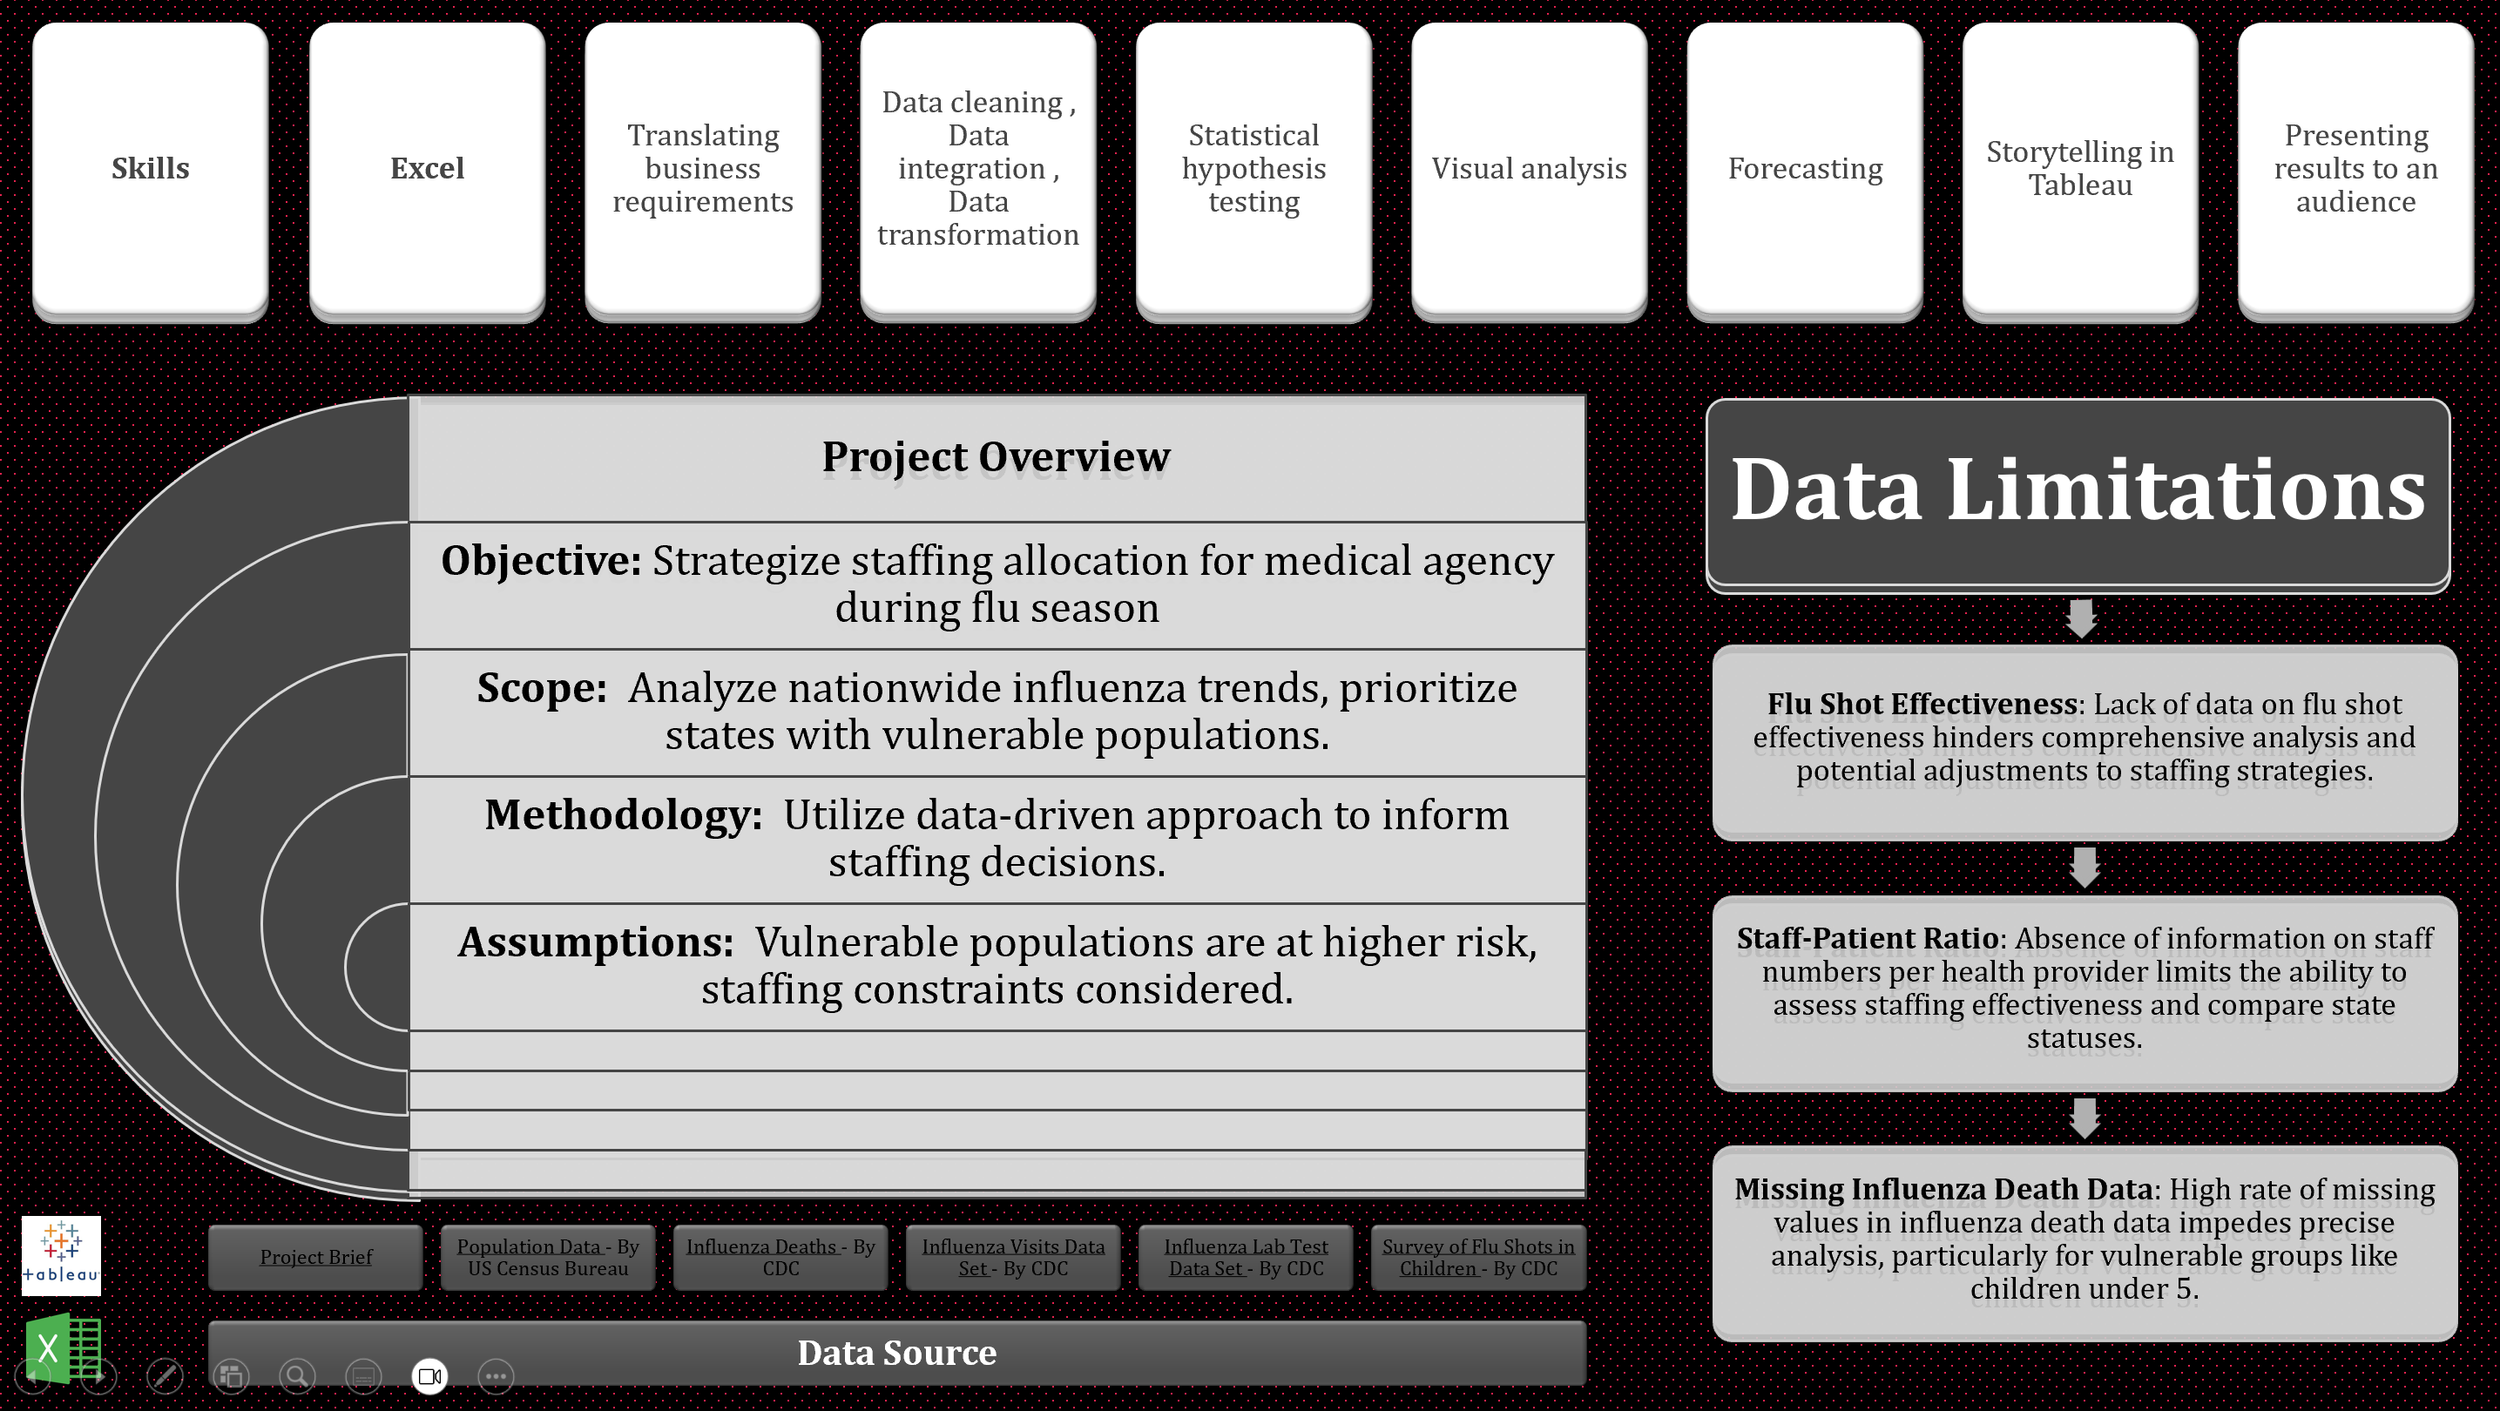
Influenza season in the United States leads to increased illness, especially in vulnerable populations, resulting in a higher demand for hospital and clinic staff. The goal of this project is to determine when and how many staff to allocate to each state to effectively manage the increased patient load during flu season.
Business Requirements
Technical Skills: Analyze data to draw insights.
Soft Skills: Communicate insights effectively to stakeholders.
Tasks:
Distill business requirements into analyzable questions.
Source and curate data to answer these questions.
Present insights in an easily consumable format.
Goal
To assist a medical staffing agency in planning for influenza season by analyzing trends in influenza incidence and informing proactive staffing needs across the United States.
Assumptions
Vulnerable populations (elderly, chronically ill, pregnant women, and young children) are most affected by the flu.
Flu vaccinations reduce the likelihood of flu infections.
Data Overview
Population Data: Demographics and influenza deaths (2009–2017).
Influenza Laboratory Tests & Patient Visits: ILI visits and lab tests data (2010–2019).
Children Flu Shots: Vaccination data for children (2017).
Data Limitations
Population Data: Estimates with potential errors; missing values required imputation.
Influenza Death Data: Missing values for people under 50; limited data for children under 5.
Lab Tests & Patient Visits: Missing values; outdated lab data (up to 2015).
Children Flu Shots: Only 2017 data was available; there was no vaccination data for people older than 3.
Analysis Steps
Data Sourcing:
Collected data on population demographics, influenza deaths, laboratory tests, patient visits, and children’s flu shots.
Prepare Data:
Basic descriptive analysis, data cleaning, data transformation, and hypothesis testing.
Descriptive Analysis:
Detailed the average population, vulnerable population, patient counts, and influenza deaths per state.
Statistical Analysis:
Correlation analysis between vulnerable populations and influenza deaths; hypothesis testing on age-related mortality differences.
Data Analysis:
Assessed influenza seasonality, prioritized states with large vulnerable populations, and identified data limitations.
Data Visualization & Storytelling: Created visualizations in Tableau to communicate findings.
Results & Insights
Descriptive Analysis:
Average state population: 6,150,269.
Average vulnerable population: 1,242,148.
Average annual ILI patients per state: 726,236.
Average influenza-related deaths: 918 (6% of ILI patients).
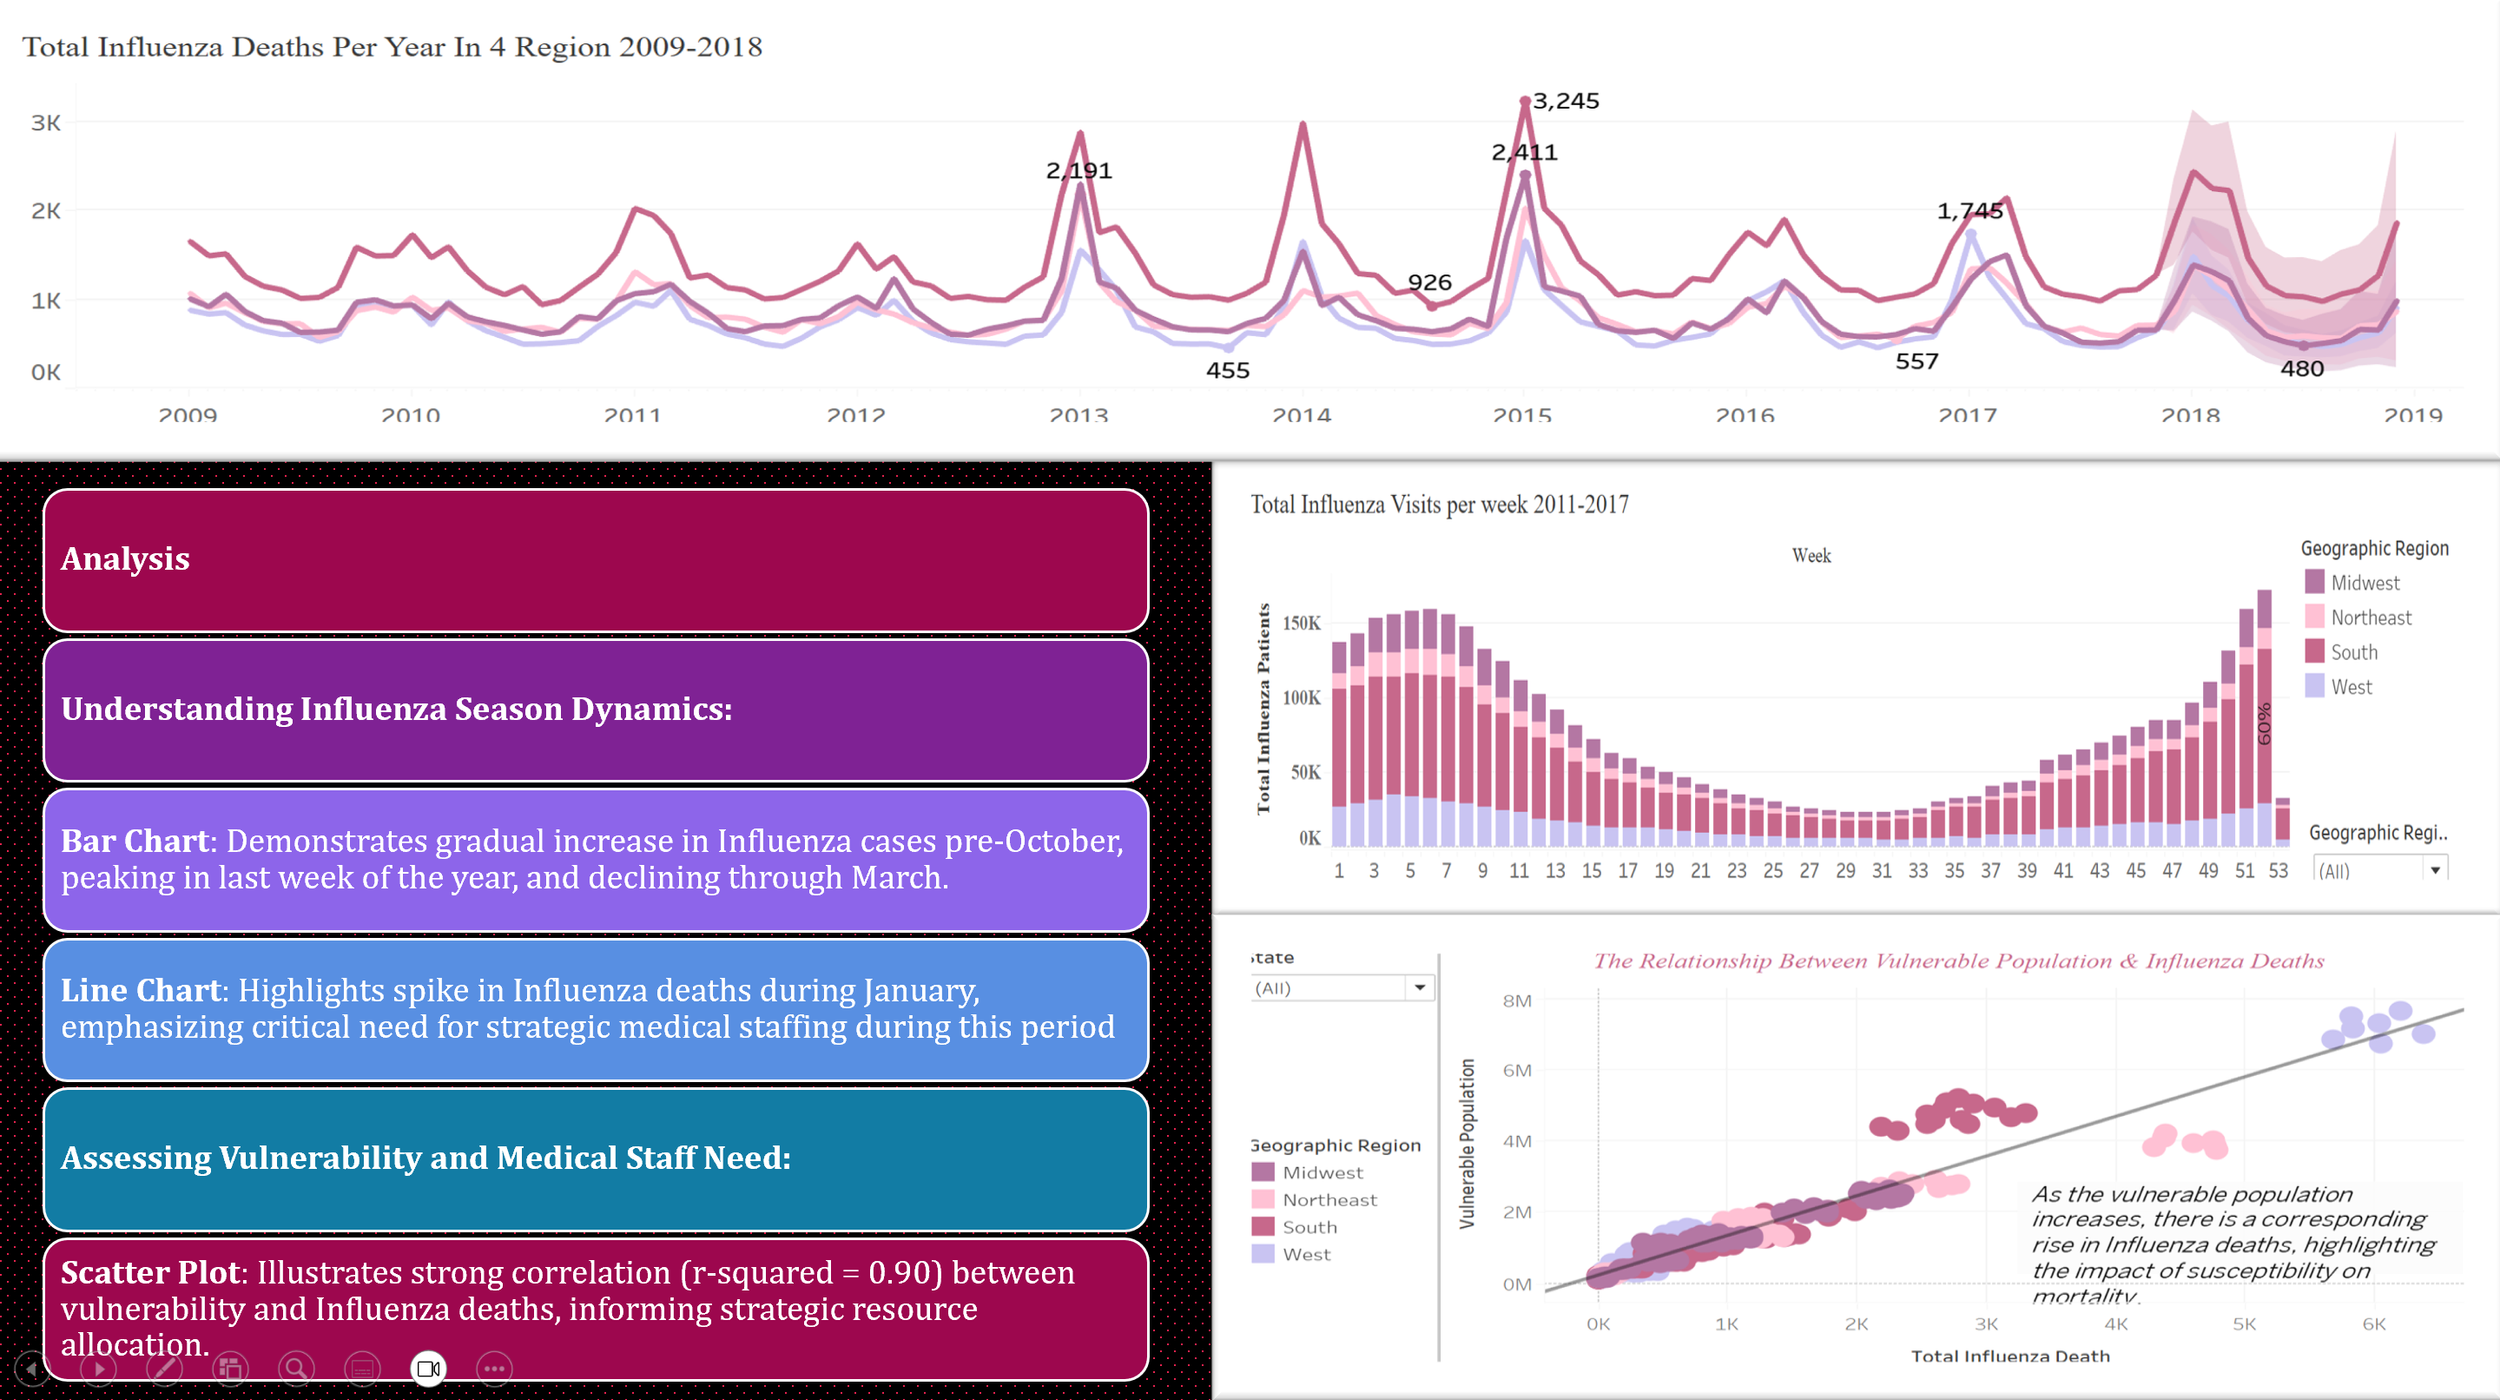
High correlation (95%) between vulnerable population size and total influenza deaths.
Hypothesis Testing:
There was a significant difference in ILI-related deaths between those aged 65+ and younger populations (p < 0.05).
Seasonality:
Influenza cases rise in October, peak in December and January, and decrease by March.
Vulnerable Populations:
Higher vulnerability correlates with more influenza deaths.
State Prioritization:
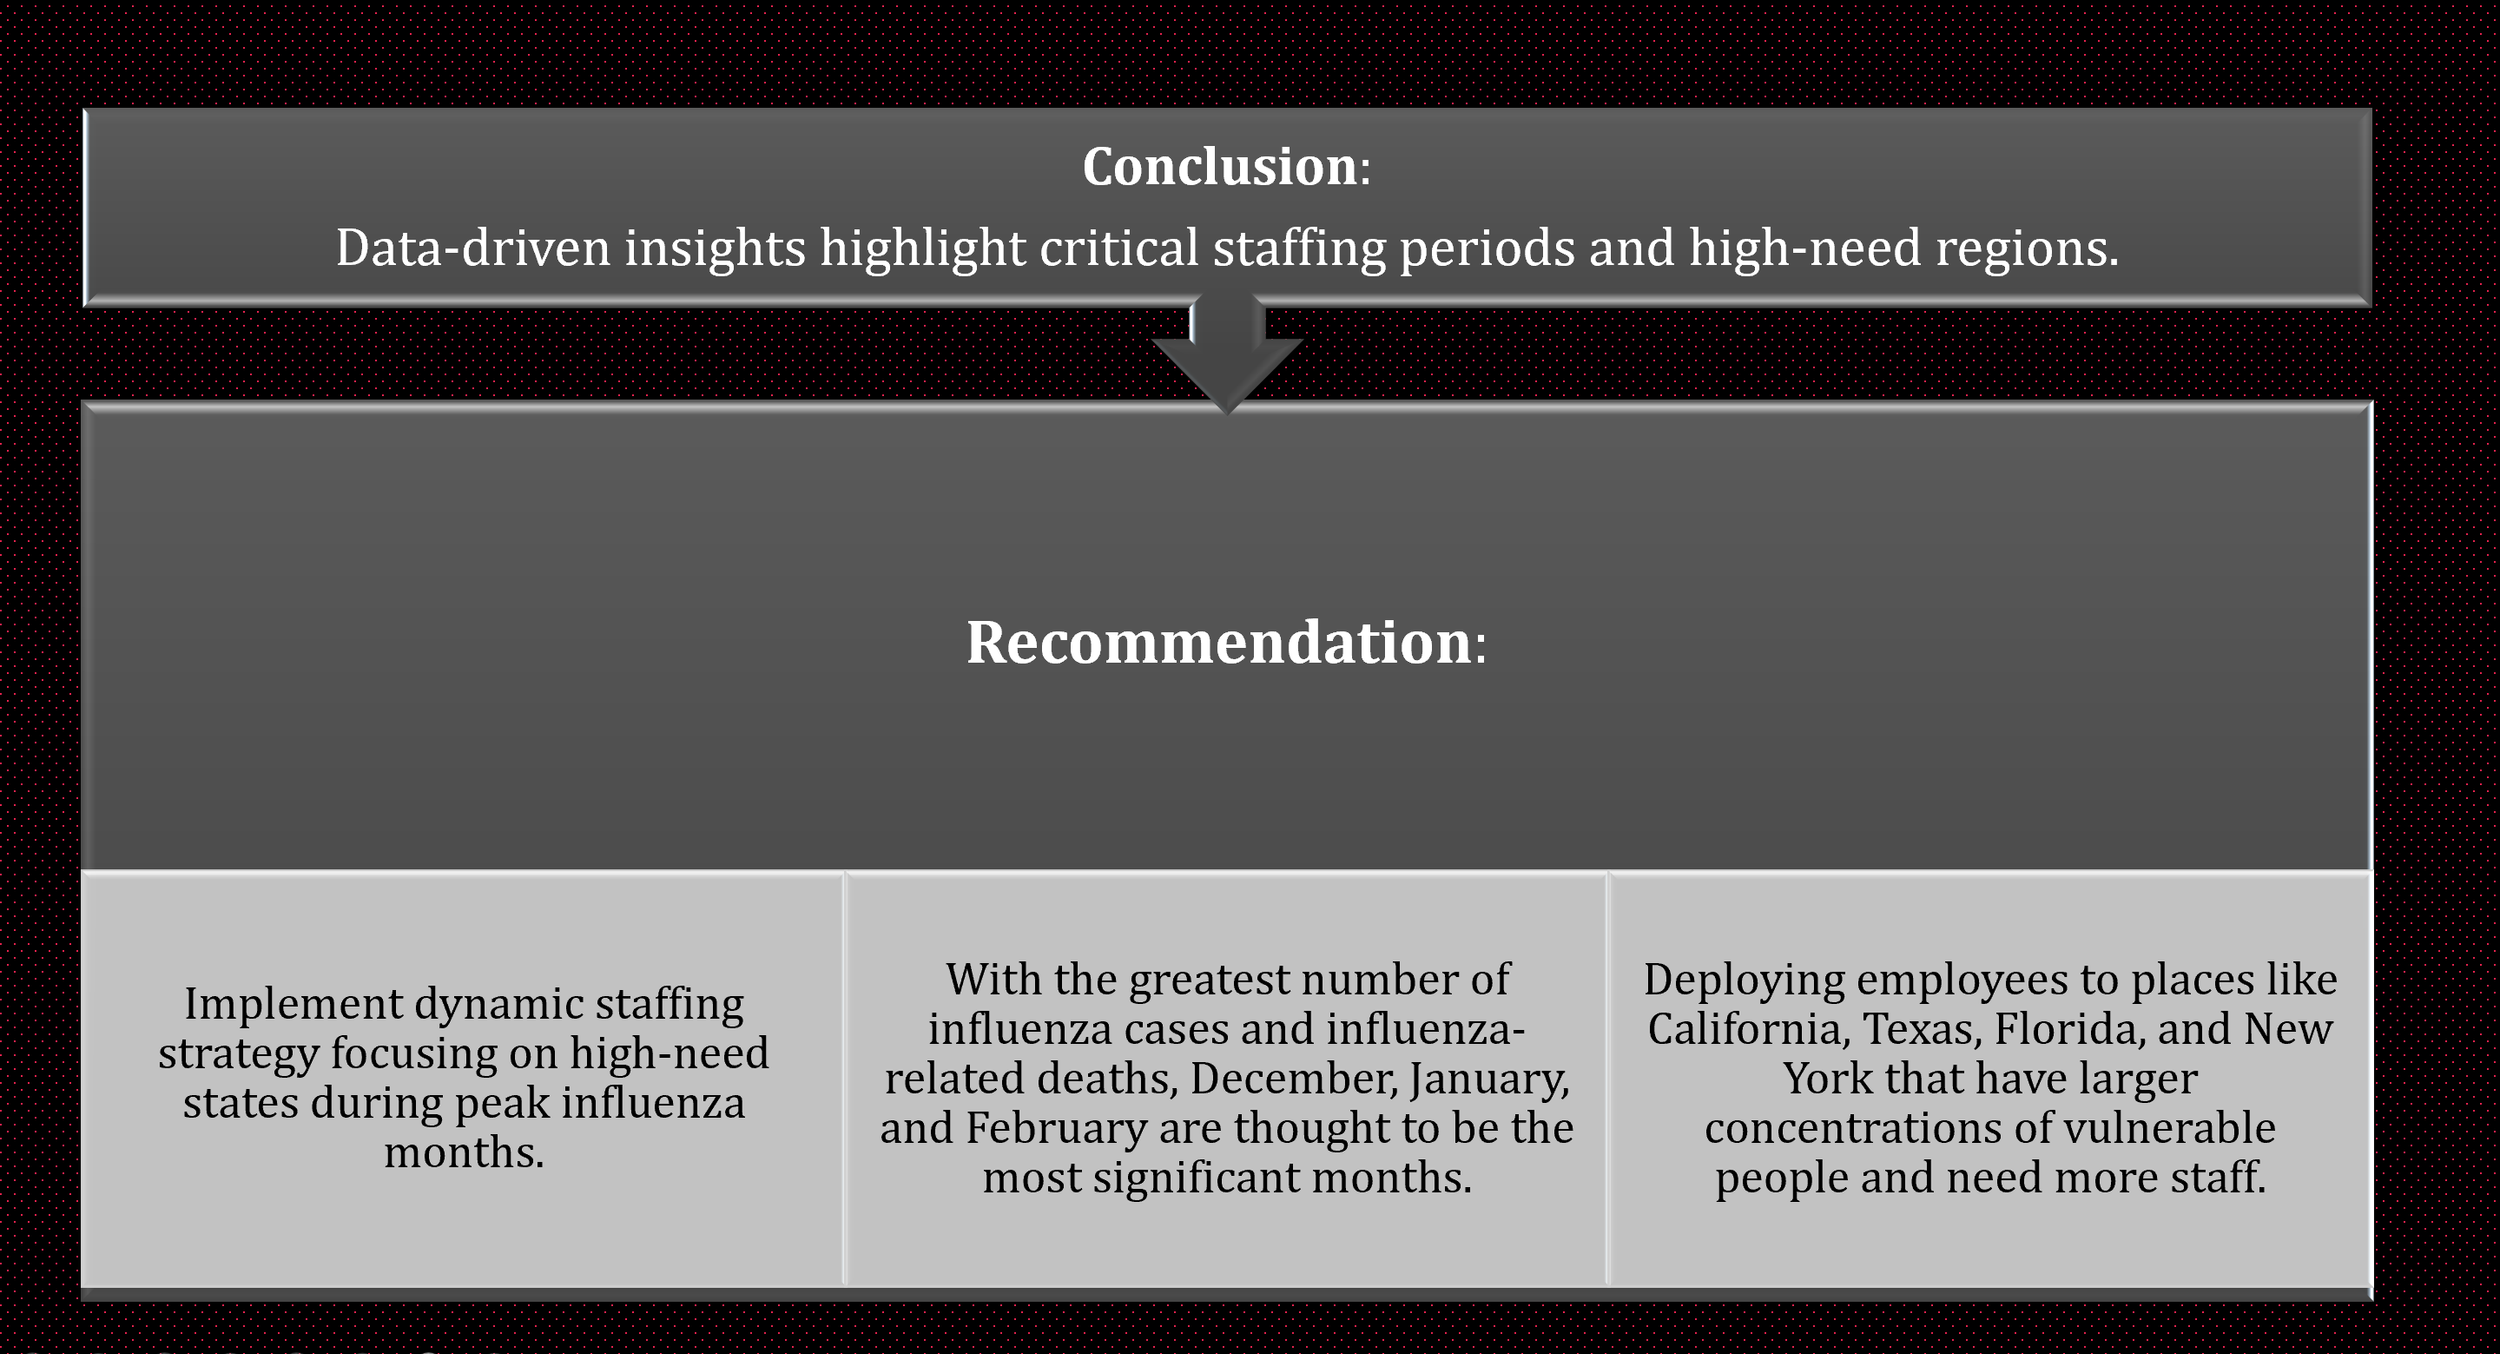
California, Texas, Florida, and New York were identified as high-need states.
Visualizations:
Created scatter plots, choropleth maps, and box plots to illustrate data trends.
Final Recommendations
Staff Deployment: Focus on December, January, and February for staffing.
High-Need States: Prioritize California, Texas, Florida, and New York.
Medium-Need States: Include Pennsylvania, Illinois, Ohio, Michigan, North Carolina, Georgia, New Jersey, and Virginia.
Evaluation and Feedback
Post-Intervention Analysis: Compare year-over-year influenza mortality rates and conduct surveys among staff and patients to evaluate the effectiveness of staffing interventions.
Challenges
Data Gaps: Managed missing values and outdated data.
Complex Analysis: Integrated multiple data sources and performed advanced statistical analyses.
Visualization Choices: Selected appropriate visualizations for effective communication.
Deliverables
Interim Report: Detailed progress, descriptive and statistical analyses.
Tableau Storyboard: Interactive visualizations supporting recommendations.
Screencast Presentation: Walkthrough of the Tableau Storyboard with explanations.
Conclusion
This project provided crucial insights into influenza season trends, helping to optimize the deployment of medical staff during peak times. The analysis prioritized states based on vulnerability and influenza mortality rates, ensuring that the staffing agency can effectively allocate resources to manage the increased patient load during influenza season.


