Project Overview
Predicting Cancer Incidence and Mortality Based on Socioeconomic and Environmental Factors
Introduction
This project sought to uncover the influence of socioeconomic variables on cancer incidence and mortality from 2010 to 2020, leveraging detailed datasets from the CDC and County Health Rankings. The aim was to provide actionable insights for public health strategies, focusing on the disparities in cancer outcomes influenced by socioeconomic conditions.
Data Sources and Collection
The data was sourced from two key datasets:
CDC’s United States Cancer Statistics (USCS):
This dataset includes registry data from the National Program of Cancer Registries (NPCR) and the Surveillance, Epidemiology, and End Results (SEER) program, encompassing demographic and tumor characteristics such as age, gender, cancer type, and stage at diagnosis.
County Health Rankings:
Compiled by the University of Wisconsin Population Health Institute, this dataset provides comprehensive information on health outcomes and factors influencing health at the county level, including socioeconomic metrics like income levels, insurance coverage, and lifestyle factors such as smoking rates.
GeoJSON File for Map Visualization:
The GeoJSON file used for the map visualization in this project was sourced from PublicaMundi's MappingAPI repository. The file contains geographical boundaries that are essential for creating accurate and informative maps.
You can find and download the GeoJSON file at the following link: PublicaMundi GeoJSON Data.
Methods and Analysis
The analysis involved merging these datasets on a 'State-Year' basis, followed by rigorous data cleaning and preprocessing in Python using pandas and NumPy.
Exploratory Data Analysis (EDA) was conducted to identify trends and patterns, while inferential statistics and regression models were applied to quantify the relationships between cancer rates and socioeconomic variables. Matplotlib and Seaborn were utilized for visualization to better understand these relationships.
Methods and Analysis
Data Integration and Cleaning:
Merged cancer incidence and mortality data from the CDC with socioeconomic data from County Health Rankings based on 'State-Year' columns.
Cleaned and preprocessed the data using Pandas to handle missing values, standardize formats, and eliminate duplicates, ensuring data quality for accurate analysis.
Exploratory Data Analysis (EDA):
Conducted EDA to uncover underlying patterns and distributions within the data, using Python libraries like Matplotlib and Seaborn for visualization.
Generated descriptive statistics to summarize the central tendencies, dispersion, and shape of the dataset's distributions.
Geospatial Analysis & Visualization:
Developed comprehensive maps using Folium, integrating choropleth visualizations with overlaid circle markers to represent dual variables—showing how both cancer rates and socioeconomic factors vary geographically.
Incorporated a legend and additional markers to denote different data points, using color and size to provide clear, at-a-glance insights into health outcomes relative to socioeconomic status.
Cluster Analysis:
Performed K-means clustering to explore how variables such as adult smoking rates, physical inactivity, and mental health provider rates cluster across different states. This helped identify patterns and relationships that were not immediately obvious from the raw data.
Visualized clusters using Seaborn and Matplotlib, highlighting distinct groups based on socioeconomic and health-related behaviors.
Time Series Analysis:
Filtered and prepared time series data specifically for lung cancer to analyze trends over the years from 2010 to 2020.
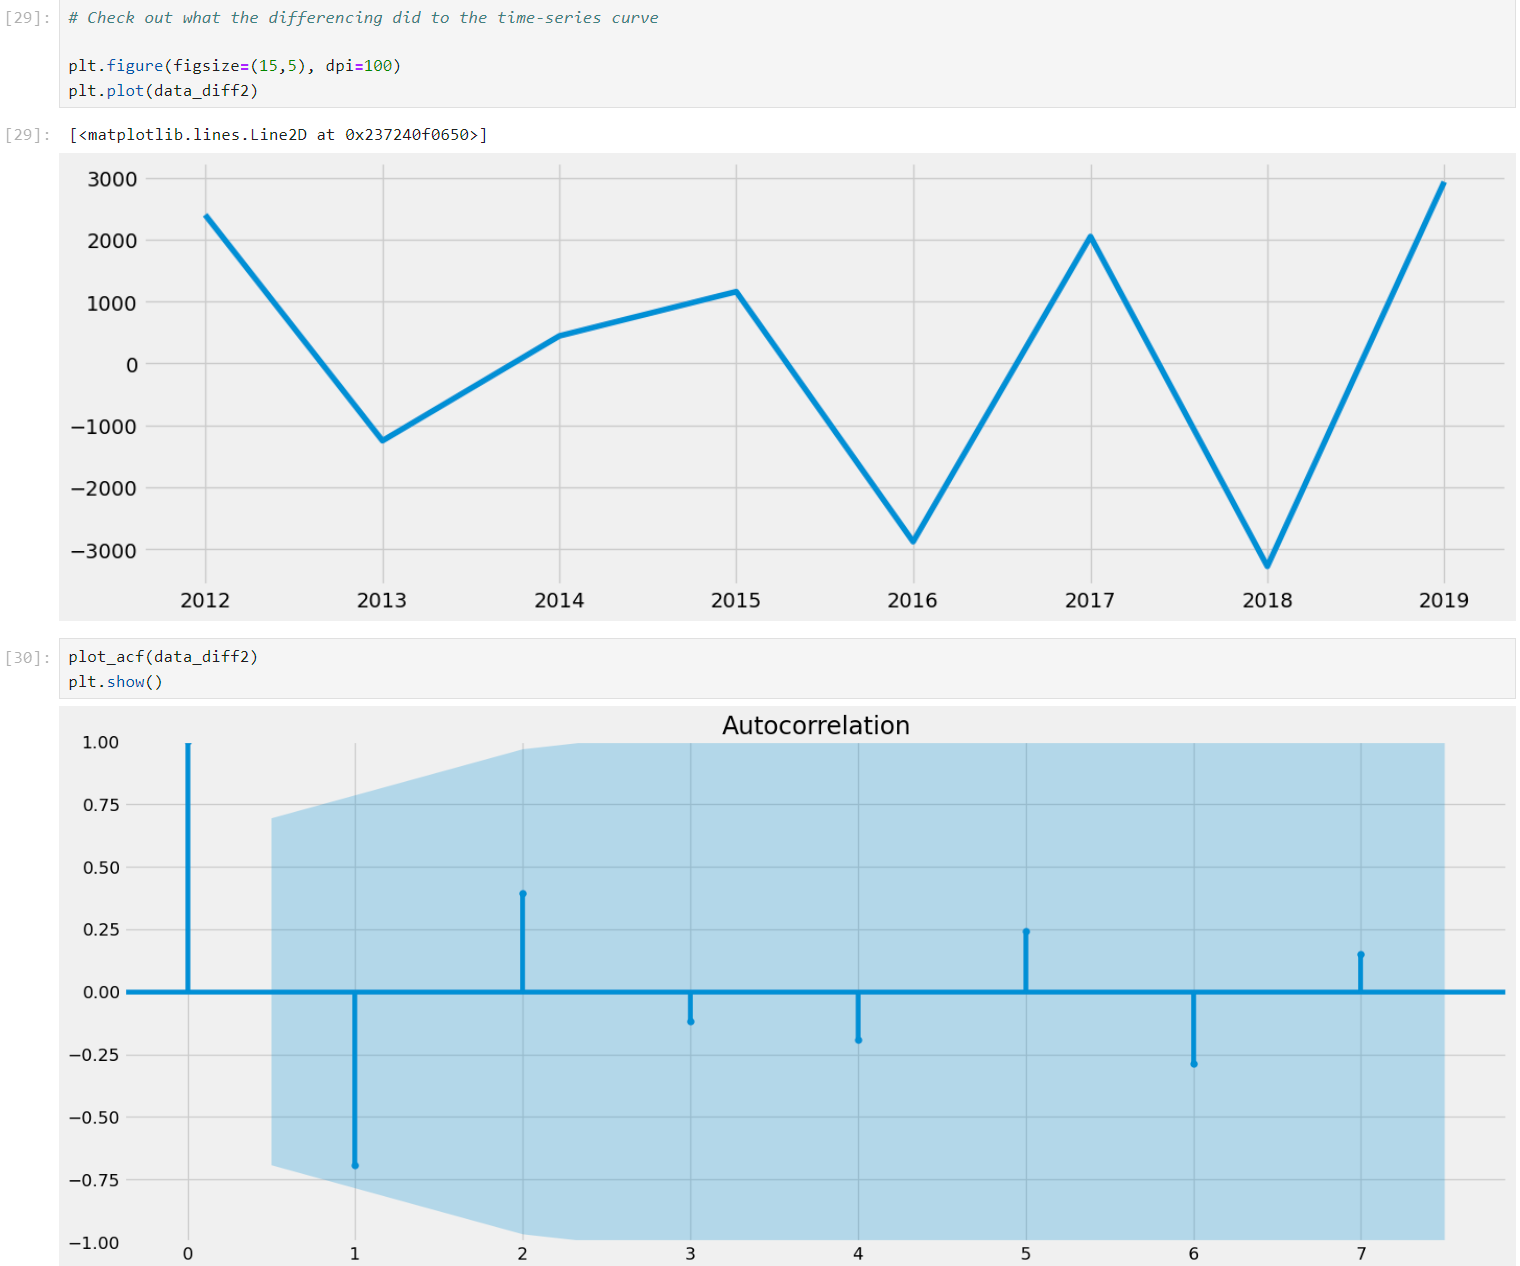
Used the Dickey-Fuller test to assess the stationarity of the time series, identifying the need for transforming the data to achieve stationarity, which is critical for effective time series forecasting and analysis.
Applied transformations such as differencing and logarithmic conversion to stabilize the variance and mean of the series, which is essential for the reliability of any subsequent time series models.
Statistical Analysis and Model Building:
Applied linear regression to assess relationships between cancer outcomes (incidence and mortality) and individual socioeconomic factors like smoking rates and median household income.
Utilized multiple regression analysis to evaluate the combined impact of various socioeconomic variables on cancer rates, enhancing the model's predictive power and complexity.
Model Validation and Refinement:
Employed cross-validation techniques to assess the model’s performance and stability, ensuring that the findings are reliable and generalizable across different data subsets.
Checked for multicollinearity among predictors to ensure that the model coefficients were interpretable and statistically valid.
Results Interpretation:
Interpreted the coefficients from the regression model, providing insights into how significant each socioeconomic factor is in relation to cancer mortality and incidence rates.
Discussed the model's mean squared error and R^2 score to quantify the accuracy and explanatory power of the model, highlighting the impact of socioeconomic factors on cancer outcomes.
Results
The project identified key correlations, such as a significant link between smoking rates and lung cancer mortality. Multi-variable regression analysis further highlighted how combined socioeconomic factors could predict cancer outcomes, with the model achieving an R2 score of 0.72, suggesting strong explanatory power. Such findings indicate that lower socioeconomic status and poorer health-related behaviors are closely associated with higher cancer mortality rates.
Key Results
Cancer Incidence and Mortality Trends:
Over the decade from 2010 to 2020, the incidence and mortality rates of colon and rectal, lung and bronchus, and pancreatic cancers were higher in men than in women.
Breast cancer in females and prostate cancer in males were the most common cancers in the U.S., while lung and bronchus cancer had significantly higher mortality rates than other cancers.
Correlation Analysis:
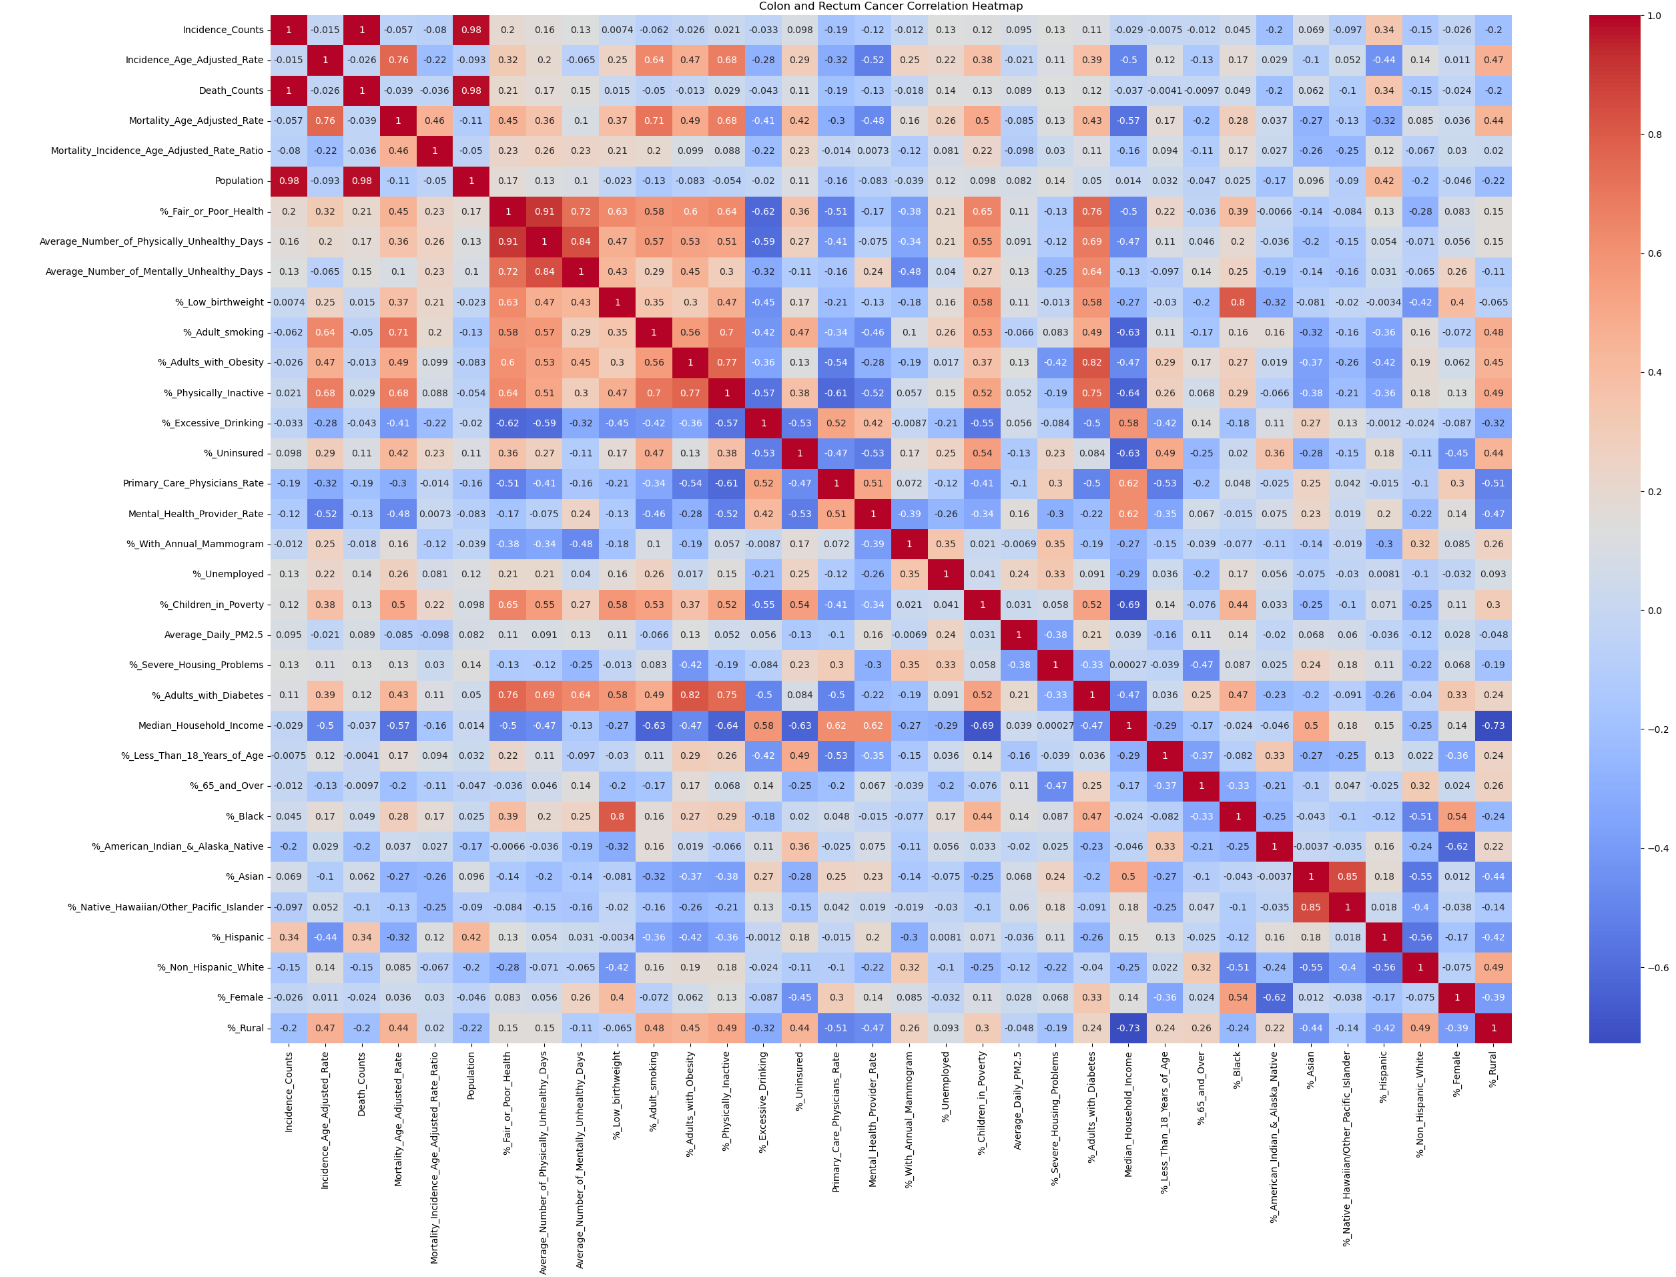
The correlation heatmap revealed strong correlations within socioeconomic variables but not between cancer statistics and socioeconomic features at the aggregated level.
A moderate negative correlation was observed between the mortality-to-incidence ratio of breast cancer and median household income, indicating higher mortality in lower-income states.
Significant correlations were found between the incidence and mortality rates of lung and bronchus cancer and factors such as smoking rates, physical inactivity, median household income, and mental health provider rates.
Regression and Clustering Analysis:
Linear regression showed that a 1% increase in adult smoking rates corresponded to a 2.22 unit increase in lung and bronchus cancer mortality rates, with an R² score of 0.68.
K-means clustering identified three distinct groups based on smoking rates, physical inactivity, and mental health provider rates, highlighting the role of these factors in cancer outcomes.
Clusters with higher percentages of smoking and physical inactivity had higher mortality rates, while clusters with higher mental health provider rates had lower mortality rates.
Recommendations
Targeted Public Health Interventions:
Smoking Cessation Programs:
Given the strong correlation between smoking rates and lung cancer mortality, states with higher smoking rates should implement robust smoking cessation programs.
Physical Activity Promotion:
Programs promoting physical activity should be prioritized, especially in regions with higher rates of physical inactivity.
Mental Health Services:
Increasing access to mental health services can contribute to better overall health outcomes and lower cancer mortality rates.
Policy and Resource Allocation:
Resource Allocation:
Allocate more resources to states and regions with lower median household incomes and higher cancer mortality rates to reduce health disparities.
Healthcare Access:
Improve healthcare infrastructure and access in underserved areas to provide timely and adequate care for cancer patients.
Future Steps
Further Analysis with Additional Predictors:
Incorporate more predictors, such as dietary habits, environmental factors, and genetic data, to refine the models and improve predictive accuracy.
Explore advanced modeling techniques, like machine learning, to capture complex interactions between variables.
Longitudinal Studies:
Conduct longitudinal studies to examine the long-term effects of socioeconomic and lifestyle factors on cancer incidence and mortality.
Limitations and Biases
Data Limitations:
The USCS and CHR&R datasets may have biases due to underreporting, misclassification, and regional variability in diagnostic criteria and healthcare infrastructure.
Socioeconomic factors affecting healthcare access and reporting can lead to the underrepresentation of certain populations.
Measurement Errors:
The CHR&R dataset, especially in small counties, is subject to measurement errors and inconsistencies due to the use of national averages to fill gaps.
Temporal Changes:
Changes in data collection methods over time and the impact of events like the COVID-19 pandemic can skew the data, affecting comparability and accuracy.
Conclusion
This study underscores the critical need for targeted public health interventions and policies that address socioeconomic disparities. By mapping the landscape of how social determinants affect cancer outcomes, we can prioritize efforts to mitigate the impact of the most detrimental factors, ultimately improving public health and reducing cancer mortality rates.
Reports & Visualizations
The project overview and motivation are summarized in a Word report. The report includes detailed descriptions of the data cleaning processes, data sources and collection methods, limitations, biases, and ethical considerations. Additionally, a final presentation for this analysis has been created on Tableau Public. Here is the link to the visualizations.
Acknowledgments
Centers for Disease Control and Prevention (CDC)
National Program of Cancer Registries (NPCR)
Surveillance, Epidemiology, and End Results (SEER) Program
University of Wisconsin Population Health Institute
Robert Wood Johnson Foundation
I would like to express my gratitude to OpenAI's ChatGPT for providing valuable guidance and support throughout this project. The insights and assistance were instrumental in completing the data analysis, visualization, and modeling tasks.


