Instacart Sales Analysis and Customer Segmentation
Analyzing Customer Purchasing Patterns for Instacart
Instacart Sales Analysis and Customer Segmentation
I worked with multiple datasets for Instacart using Python. I subsequently wrote a report outlining my analysis methodology, findings, and suggestions in response to important Instacart business queries.
Objective
As an analyst for Instacart, an online grocery store operating through a mobile app, the primary objective was to conduct an initial data and exploratory analysis to derive insights and propose strategies for better customer segmentation. This analysis aimed to uncover sales patterns and identify different customer profiles based on provided criteria.
Context
Instacart stakeholders are keen on understanding the diverse range of customers in their database and their purchasing behaviors. They recognize the need for targeted marketing strategies tailored to specific customer profiles to maximize product sales. The key questions guiding this analysis include:
What is the distribution of users based on brand loyalty?
Do ordering habits vary among customers based on loyalty status or region?
Is there a correlation between age, family status, and ordering habits?
What demographic classifications emerge from the data?
What differences exist in ordering habits across different customer profiles?
Data & Tools
The analysis utilized multiple open-source datasets from Instacart, including a custom customer dataset (created and included for the purpose of this project by Career Foundry). The data were analyzed using Python programming language along with libraries such as pandas, numpy, matplotlib, seaborn, and scipy.
CareerFoundry Data Sets: Customers Data Set
Instacart Data Sets: Data Dictionary
Instacart Online Grocery Shopping Dataset 2017: (Citation: “The Instacart Online Grocery Shopping Dataset 2017”, Accessed via Kaggle)
Methodology
The analysis followed a structured approach encompassing data cleaning, exploration, visualization, and recommendation stages. Python scripts were used for data cleaning, manipulation, and statistical analysis. Key steps included:
Data Preparation:
Installed and imported the necessary Python libraries.
Loaded multiple datasets into Jupyter notebooks.
Data Cleaning:
Handled missing values, standardized data formats, and ensured data consistency.
Fixed mixed-type variables and removed duplicates.
Data Exploration and Querying
Descriptive Analysis: Calculated mean, median, mode, max, and min for various columns.
Data Wrangling: Adjusted data types, renamed columns, and created new data frames based on criteria.
Merging Data: Combined customer and product datasets created new columns with conditional logic.
Visualization: Developed histograms, bar charts, line charts, and scatterplots to analyze relationships between variables.
Recommendations: Derived actionable insights to inform marketing strategies and product recommendations.
Results
Order Distribution:
Most orders occur over the weekend, with Saturdays and Sundays accounting for the highest volumes.
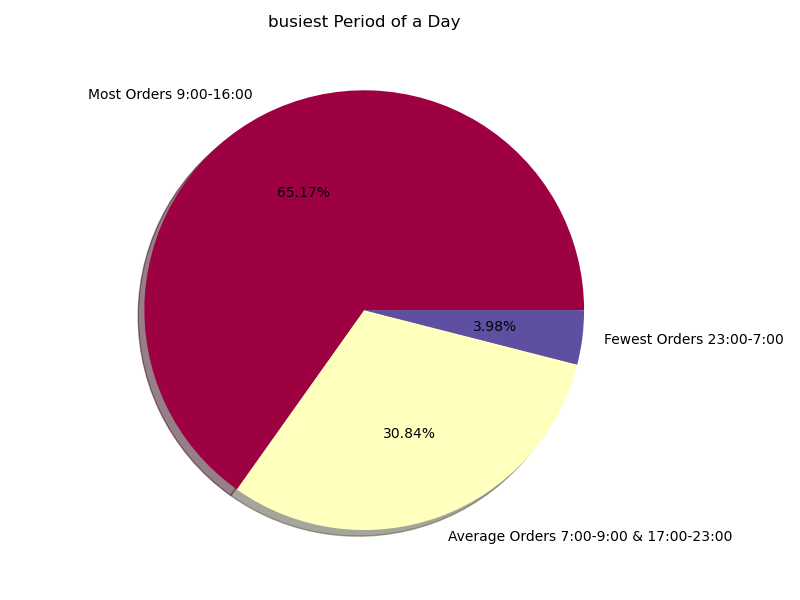
Peak ordering times are between 9 AM and 4 p.m.
Spending Patterns:
There was no significant difference in spending across various times of the day.
Product prices are mostly below $15, with 67% of products falling into the low-range price group.
Product Popularity:
Top departments: Produce, Dairy Eggs, Snacks, Beverages, and Frozen.
Popular products: bananas, strawberries, baby spinach, avocados, and large limes.
Customer Segmentation:
51.27% of customers are regulars (10–40 orders), 31% are loyal (more than 40 orders), and 15.51% are new (less than 10 orders).
Shopping habits are similar across customer segments, with a preference for fresh and non-perishable foods.
Demographic Analysis:
Most customers are married, aged 18–80, with a sizable portion under 25 or over 65.
Income varies, with a noticeable gap between those under and over 40 years of age.
Regional distribution: South (33.30%), West (25%), Midwest (23%), Northeast
Recommendations
Understanding Customer Patterns:
Schedule targeted ads during peak shopping times (9 AM to 4 PM) on weekends to maximize visibility and engagement.
Tailoring Pricing for Maximum Impact:
Implement subtle price adjustments around low-spending times (e.g., 10 AM) to influence purchasing decisions positively.
Focus marketing efforts on items below $15.
Spotlight on Popular Product Categories:
Promote popular items like bananas, strawberries, and avocados.
Reward loyal customers with targeted promotions.
Challenges and Solutions
Data Integration:
Managed integration of multiple datasets, ensuring data integrity and consistency through regular consistency checks.
Complex Analysis:
Addressed complex relationships and large data volumes using efficient data manipulation techniques in Python.
Conclusion
This analysis provides a comprehensive understanding of Instacart’s customer base and their purchasing behaviors. The insights derived from this analysis can inform targeted marketing strategies, optimize pricing, and enhance product promotions to cater to different customer segments effectively. The detailed visualizations and recommendations will help Instacart stakeholders make data-driven decisions to maximize sales and customer satisfaction.
Report
The findings and recommendations of the analysis are summarized in an Excel report, which includes detailed descriptions of data cleaning processes, data wrangling techniques, visualizations, and strategic recommendations.


